This is the methodology and data write up of the publication “Will Children of Current Millennials Become Future Public School Students?” found here.
The data can be found here.
Methodology
Our study analyzes the relationship between Millennials, housing values, migration, and past public school enrollment in D.C. to consider implications for future public school enrollment. We compare D.C.’s Millennials to their 2000 counterparts, examine trends in public school enrollment, estimate future public school enrollment, and identify areas of the city where Millennials are likely to live. Our key research questions include:
- Can changes in the parent cohort inform public school enrollment changes? How do Millennials represent a departure from the cohort of the same age who lived in D.C. as today’s Millennials were coming of age?
- Given trends in cohort changes of public school students and recent migration patterns, will growth in public school enrollment continue?
- If Millennials stay in the city when they have children, where are Millennials with families likely to live?
1. Who are D.C.’s Millennials, and are they different from the previous cohort?
To provide more context on why public school enrollment may change, we examine the characteristics of Millennials, who are most likely to be today’s parents, and compare them to their counterparts who were the same ages in D.C. in 2000. We consider Millennials to be anyone who is 20 to 34 years old in 2016. This adjusts the Pew Research Center’s definition of those born between born between 1981 and 1996 by one year to allow us to take advantage of age groups commonly reported by the American Community Survey. We will first present a profile of D.C.’s Millennials in 2016. How many live in the District, and where do they live by school boundary? Were they born in D.C.? How many have had children already? What is their racial and ethnic composition? In terms of economic opportunity, what are average incomes, home ownership rates, and educational attainments?
We then examine if these characteristics differ statistically for members of the previous generation who were the same ages in 2000. We will use American Community Survey (ACS) 1-year estimates when they are available. When the estimates are not published, we will calculate estimates using the Public Use Microdata Sample (PUMS) and use person or household weights to calculate standard errors. ACS estimates are commonly published for the 20-34 age range, so we will use these ages when we analyze the microdata to be consistent. We will also look at in- and out-migration using IRS data on migration by income and age in 2011 through 2016 to see if migration trends are changing over time.
2. Will public school enrollment continue to climb?
We first establish the extent to which families have historically stayed in the District on a net basis using cohort change ratios, calculated as the number of children in D.C.’s public schools divided by the number of births to mothers living in D.C. the relevant number of years in the past. This is a net measure, and does not track individuals or separate in- and out-migration, nor movement to private schools. We focus on ages and “gateway grades” that allow for transition into school or the next grade band: kindergarten (age 5), grade 5 (age 10), grade 8 (age 13), and grade 12 (age 17). We follow the cohort born in 1998 in D.C. through high school in school year 2015-16 to see how many are living in D.C. and attending public schools in each gateway grade (see Table 1 below for calculations of the 1998 cohort). Using 1998 as a birth year for this cohort simulates how the children of the Millennials’ counterparts living in D.C. around the year 2000 stayed in the District’s schools. It also allows us to follow the cohort through high school and compare to ACS population estimates. We follow up with cohorts every three years (born in 2001, 2004, 2007, and 2010) to see any changes over time. We also compare the 1998 cohort change ratios to those in similar cities that have a high degree of public school choice (Campbell, Heyward, & Gross, 2017), rapidly growing populations, and consistent city borders: Boston, Denver, New Orleans, and Oakland. Finally, we compare cohort changes over time by race and ethnicity.

Sources: Office of the State Superintendent for Education (OSSE)’s enrollment audits, U.S. Department of Education National Center for Education Statistics (NCES), and the Center for Disease Control (CDC), WONDER database.
To see whether these patterns are changing, we calculate cohort transition ratios for transitions between gateway grades in recent years (2015, 2016, and 2017) and in 1998. For example, we calculate how many students are in grade 12 in 2015 compared to students in grade 8 four years earlier (see Table 2 below for calculations).

Next, we use this information to make assumptions about the extent to which D.C.’s public school enrollment will continue to grow. We produce three five- and ten-year estimates of public school enrollment growth in key gateway grades based on births in 2016. First, we will assume that families will stay in public schools at the same rates that they did historically, using cohort transition ratios of those born in 1998. Second, we will assume that families will stay in D.C. based on the average of cohort transition ratios in the three most recent years. Third, we will assume that the rate at which families stay in D.C. continues to increase by the same amount that it has between 1998 and the three most recent years. We estimate growth by grade for the relevant future year based on births or current enrollment (estimates for 2021-22 inform the 2026-27 estimates). Growth is then annualized and calculated for school years 2021-22 and 2026-27. Finally, growth for one grade is extrapolated to the full grade band to estimate total growth.
3. Where are Millennials with children likely to live?
First, we look at D.C.’s Office of Planning population forecasts. This shows areas of the city with a school-age population that is likely to grow as a reference.
Next, we combine information on Millennials’ income with housing data to identify areas of the District that where Millennials with families would be able to buy a home. To estimate which properties families can buy, we first calculate household income at the median and 75th percentiles for Millennial individuals without children. We combine income data with a housing dataset compiled for the D.C. Policy Center’s report, Taking Stock of the District’s Housing Stock (Sayin Taylor, 2018) to connect to data on capacity and income necessary to afford a home. We use the number of bedrooms to calculate capacity for all single-family homes using the Taking Stock methodology. We assume that each bedroom can comfortably accommodate 1.5 persons, rounded up to the next whole. For example, a one-bedroom can hold two persons, and a two-bedroom can hold three. We exclude single-family units listed with more than one unit (21 units out of 93,255) for simplicity, and an additional 58 units where data on the number of bed-rooms were missing. We focus on single-family houses with a capacity of four to accommodate a family.
We then turn to the income necessary to afford a home as calculated for Taking Stock. This methodology first generates an estimated market value by dividing the assessment value by the average assessment to market value ratio for available properties by neighborhood. Then, it divides the estimated market value by a capitalization rate published by the Office of the Chief Financial Officer for income-generating properties by geographic area to estimate the annual housing cost. Finally, the annual housing cost is divided by 30 percent (a standard threshold for housing affordability) to determine the income necessary to own a home.
Given housing capacity and income necessary to own a home, we highlight areas of the city with many units that current Millennials could afford. We focus on values for single-family homes in our analysis because the data on estimated housing values (and therefore costs of home ownership) require fewer assumptions than apartments, condos, and co-ops. To reference rentals in our analysis, we compared rents for multifamily units using November 2017 multi-family rental data from Zillow (the same month as the most recent data in the housing dataset) to get a sense of how estimated housing costs per month compare. For the 36 neighborhoods with a match in both datasets, there is a strong correlation between costs of owning a single-family home and renting a unit until the owning cost of 3,400(USD) per month, at which point the correlation becomes weak.
For neighborhoods where the monthly cost of ownership is less than 3,400(USD), the ratio of data on rents from Zillow to cost of home ownership is 1.2. We then perform a few checks on these estimates. As a check on affordability, the analysis includes estimates of other potential costs, including student loans, taxes, and childcare. We also compare these areas to where the highest increases in school-age population have occurred over the previous five years to identify areas of overlap and where population is forecast to grow. We will also identify areas of potential future turnover given downsizing patterns for senior citizens aged 65 and older.
Data sources
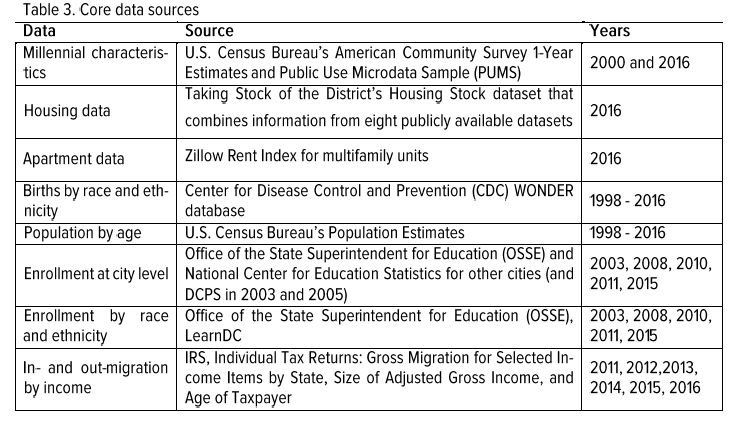
This analysis will answer our three key questions, which will connect demographic changes in the District to future and current trends in enrollment and child populations. Our core datasets include:

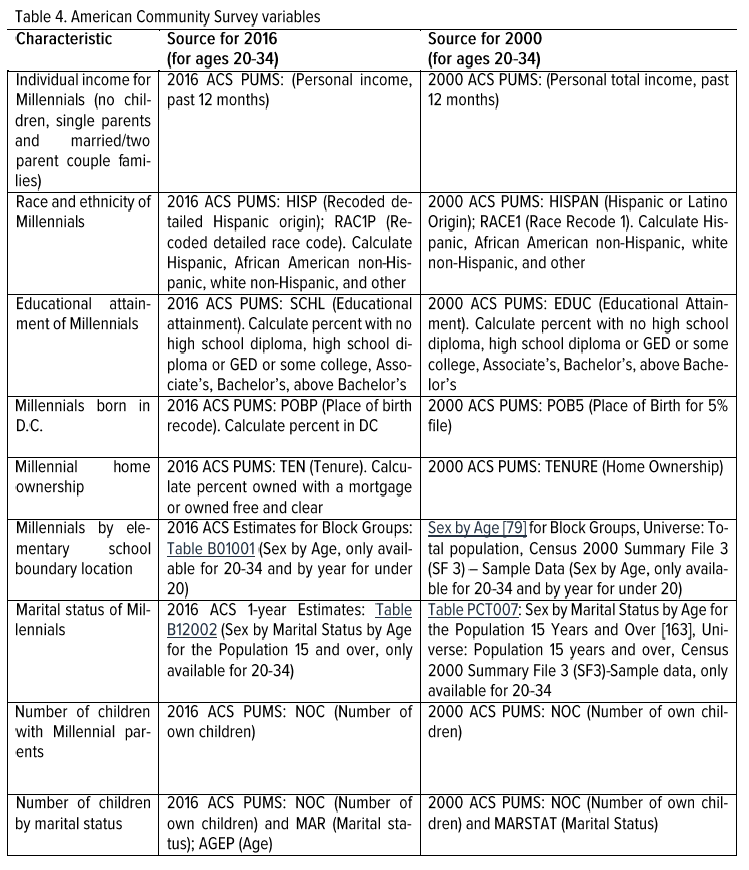
See Table 4 below for details on ACS data.
